Abstract
Purpose – In the current business environment, more uncertain than ever before, understanding consumer behavior is an integral part of an organization’s strategic planning and execution process. It is the key driver for becoming a market leader. Therefore, it is important that all processes in business are customer centric. Marketers need to harness big data by engaging in data driven-marketing (DDM) to help organizations choose the “right” customers, to “keep” and “grow” them and to sustain “growth” and “profitability”. This research examines DDM adoption practices and how companies can aim to enhance shareholder value by bringing about “customer centricity”. Design/methodology/approach – An online survey conducted in 2016 received 180 responses from junior, middle and senior executives. Of the total responses, 26% were from senior management, 39% from middle management and the remaining 35% from junior management. Industries represented in the survey included retail, BFSI, healthcare and government, automobile, telecommunication, transport and logistics and IT. Other industries represented were aviation, marketing research and consulting, hospitality, advertising and media and human resource. Findings – Success of DDM depends upon how well an organization embraces the practice. The first and foremost indicator of an organization’s commitment is the extent of resources invested for DDM. Respondents were divided into four categories; Laggards, Dabblers, Contenders and Leaders based on their “current level of investments” and “willingness to enhance investments” soon. Research limitations/implications – With storming digital age and the development of analytics, the process of decision-making has gained significant importance. Judgment and intuition too are critical to the process. Choosing an appropriate action cannot be done strictly on a rational basis. Practical implications – The results of the study offer interesting implications for managing the growing sea of data. An iterative and incremental approach is the need of the hour, even if it has to start with baby steps, to invest in and reap the fruits of DDM. The intention to use any system is always dependent on two primary belief factors: perceived usefulness and perceived ease of use; however, attitudes and social factors are equally important. Originality/value – There is a dearth of knowledge with regards to who is and is not adopting DDM, and how best big data can be harnessed for enhancing effectiveness and efficiency of marketing budget. It is, therefore, imperative to build a knowledge base on DDM practices, challenges and opportunities. Better use of data can help companies enhance shareholder value by bringing about “customer centricity”. Keywords Data-driven marketing, Customer centric, Value proposition, Digital data, Marketing metrics, Marketing analytics, Marketing dashboard, Digital marketing and marketing investment, ROMI (return on marketing investment) and diffusion of innovation Paper type Research paper
1. Introduction
The fundamentals of marketing will always be the same, despite the changing forces that shape the future of marketing. Technology connects the world, but customers resist standardization and prefer individualization. The modern-day consumers are sophisticated, knowledgeable and powerful. The ever-changing consumer buying behavior requires identifying the right audience and understanding their buying patterns (Kotler and Keller, 2012). Owing to technological advancements, digitalization and marketing analytics – especially data mining – have become invaluable tools and should be viewed as equal components of the marketing research toolkit (Hauser, 2007). “The inability to make decisions is one of the principal reasons executives fail. Lack in decision-making ranks much higher than the lack of specific knowledge or technical knowhow as an indicator of business success” – John C. Maxwell (Moore, 2014). Decision-making is a vital part of the business world. In today’s organic structure, in particular, every individual in a company has the autonomy to make a decision that affects the business. Business decisions affect many things in a company, from return on investment to branding (Ashe-Edmunds, 2017). Moreover, business decisions are prone to bias based on the perceptions of decision makers and organizational limitations, such as organizational structures and regulations (Belwal and Belwal, 2014). To overcome such bias, there is a need for data. The influx of data available to the two major proponents of an economy— customers and firms—has expanded exponentially (Walker, 2012). These large volumes of data, often referred to as “Big Data”, are converted into information that can be utilized for decision-making purposes. However, the problem that most companies face is deriving value from the data available as a point of entry to information systems. Decision makers in such organizations spend an excessive amount of time analyzing the ever-increasing data available to them to make “the most optimally, the value-creating business decision”. A business needs to employ analytics in its decision-making processes and develop its infrastructure to enable data to be stored, analyzed and used (Pearson and Wegener, 2013). Consumers no longer pay attention to irrelevant brand communications. Branding in today’s context is more to manage the business–consumer relationship in the 21st century (Vrontis and Thrassou, 2007). They now demand individualization, i.e. messages directly tapping their latent needs. Various studies aim at constructing models on how customers think, feel and choose one among the alternatives short-listed. They endeavor to learn and understand the customer’s acknowledgment of sales promotion techniques, social, political, cultural and psychological factors (Desrosiers et al., 1995). It is of paramount importance for marketers to use the abundance of available data to engage customers contextually and consistently to enhance customer experience (Gordon, 2013). In present time, managers will need a workforce with different skill sets than in the past – a workforce that is equipped enough to handle consumer analytics and other relevant analytical tools (Hofacker et al., 2016). User behavior and marketing strategies are both going on separate tracks, and there is a dire need for alignment. With the advent of digital media, the marketing function needs to understand its target audience better by examining their digital interactions. Rich data, if harnessed well, can provide unparalleled insights into sending the right message to the right consumer at the right time. Thus, data analysis by way of data-driven marketing (DDM) can result in firms gaining valuable insights into consumer behavior (Bhandari et al., 2014). One of the most comprehensive studies on the changing marketing environment conducted by IBM revealed technology as the driving factor of pervasive change. The survey involved face-to-face interviews with more than 1700 chief marketing officers (CMOs) worldwide, spanning 19 industries and 64 countries. The five biggest challenges identified by the CMOs were as follows: data explosion, social media, the growth of channel and device choices, shifting consumer demographics and financial constraints (IBM CMO Study, 2011). The study also revealed that more than 60% of the CMOs felt they were unprepared to tackle these challenges, indicating a desperate need to change the approach. For a customer-centric approach, three main methods, namely connect, collaborate and convert model, are used. This new wave of connecting contextually to build a lasting and profitable relationship with customers is pushing marketers to keep pace with technological advancements. Marketers can engage in data-driven decision-making and marketing to improve effectiveness and optimize their return on marketing investment (ROMI). A deeper understanding of classical and data analytics helps businesses make better and more informed decisions (Agrawal, 2014). A change of strategic philosophy and practice can be observed from more of orthodox planning to more on value-based reflexive mechanisms that automatically adapt to changing business needs (Vrontis et al., 2012).
1.1 Research objective
Our research focuses on understanding the present context of analytics and examines DDM adoption practices and how companies can aim to enhance shareholder value by bringing about “customer centricity” through better use of data.
2. Literature review
Today, there is a fast business impact on the data economy, and this can get associated with Analytics 3.0 (Desjardins, 2015). An unseamed mix of traditional analytics and big data and analytics plays a vital role in the success of the business. Data and data-driven decisions are regarded as “strategic assets” to business (Davenport, 2013). Analytics 3.0 also focuses on data discovery, the increased use of visual analytics, high-speed technology and analytical methods. However, many businesses are using big data technologies to optimize their business performance. Some of the problematic issues of Analytics 3.0 are the labor intensiveness of data science work, privacy implications, the need for skill set, integrated architectures, governance and transition processes (Davenport, 2013). To gain a customer, it is essential to target customers at the right time with the right offers. With advancing, technology businesses have more precious data by following the browsing activity than what has traditionally been known about the customers (Verhoef et al., 2010).
2.1 Diffusion of innovation theory
In the age of digital disruptions, industries are increasingly becoming data centric, and datadriven marketing decision and technology has now become pervasive in the industry. The Internet is the driving force, and recent studies show that it plays a part in a strategic business tool. While the use of data in the decision-making process has increased, it is imperative to understand whether or not users of the data (middle to senior business professionals) have embraced it. To understand users’ intention to adopt and reasons driving the adoption decision, we have utilized learning from one of the most widely accepted theories: diffusion of innovation theory. Technology appropriation model, i.e. (TAM) developed in the 1980s postulates that an individual’s intention to use a system depends and is always fixed by two primary belief factors: perceived usefulness and perceived ease of use (Chismar and Wiley-Patton, 2003a, b). However, further studies have been conducted to refine the model and include the importance of these, placing greater emphasis on attitude and social factors in behavioral intentions (Venkatesh and Davis, 2000). Rogers’ diffusion of innovation theory identifies factors affecting the decision to adopt an innovation about whether it will be shared and adopted by other individuals and organizations. This theory argues that adopters’ willingness and ability to foster a change depends on factors such as their awareness, interest, evaluation, trial and adoption (Rogers, 2004). The adapters are categorized as innovators, early adopters, early majority, late majority and laggards.
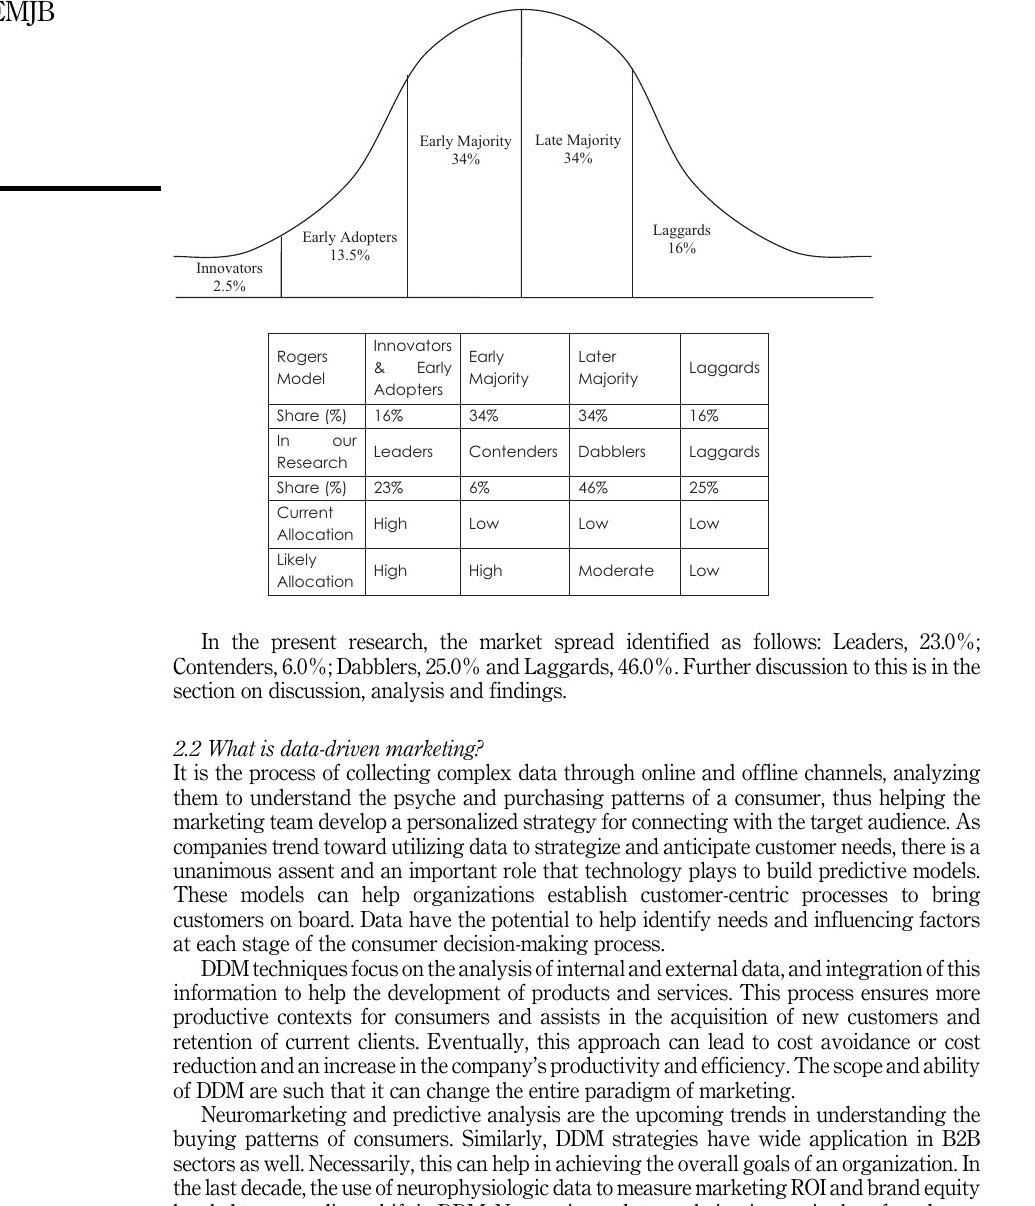
In the present research, the market spread identified as follows: Leaders, 23.0%; Contenders, 6.0%; Dabblers, 25.0% and Laggards, 46.0%. Further discussion to this is in the section on discussion, analysis and findings.
2.2 What is data-driven marketing?
It is the process of collecting complex data through online and offline channels, analyzing them to understand the psyche and purchasing patterns of a consumer, thus helping the marketing team develop a personalized strategy for connecting with the target audience. As companies trend toward utilizing data to strategize and anticipate customer needs, there is a unanimous assent and an important role that technology plays to build predictive models. These models can help organizations establish customer-centric processes to bring customers on board. Data have the potential to help identify needs and influencing factors at each stage of the consumer decision-making process. DDM techniques focus on the analysis of internal and external data, and integration of this information to help the development of products and services. This process ensures more productive contexts for consumers and assists in the acquisition of new customers and retention of current clients. Eventually, this approach can lead to cost avoidance or cost reduction and an increase in the company’s productivity and efficiency. The scope and ability of DDM are such that it can change the entire paradigm of marketing. Neuromarketing and predictive analysis are the upcoming trends in understanding the buying patterns of consumers. Similarly, DDM strategies have wide application in B2B sectors as well. Necessarily, this can help in achieving the overall goals of an organization. In the last decade, the use of neurophysiologic data to measure marketing ROI and brand equity has led to a paradigm shift in DDM. Neuroscience data are being increasingly referred to as the new “scanner” data. There has been an increasing trend in traditional market research firms entering this space, such as Nielsen Research investing in NeuroFocus, and in the number of neuromarketing companies offering proprietary neurophysiologic toolkits (Myers et al., 2010).
2.3 What is driving DDM, and what is inhibiting it?
The Winterberry Group and Global DMA carried out an ambitious research project collaborating with marketing and advertising associates around the world to understand how DDM is changing the industry. A whopping 92.2 % of panelists said that DDMA (datadriven marketing and advertising) had become a significantly important part of their marketing strategy (Braverman, 2015). The major point highlighted by global panelists was the concept of customer centricity. Panelists across the spectrum mentioned that to advance DDMA, the flow of investment into the area needs to increase. On the other hand, regulations on DDMA, for example, on collecting consumer data, do not seem to have much of an impact on its growth. Only 24.8% of the associates mentioned it as a factor that inhibits the growth of DDM (Kumar et al., 2013). Analytical tools help understand the next “would be” consumer buying pattern. Insights derived from such analysis are then used to direct, optimize and automate the decisionmaking process. Data, text and web mining techniques are some of the key contributors to making advanced analytics possible and eventually achieving business goals (Bose, 2009). Social media has helped in giving marketing a new dimension. It has not only reduced costs but is also far more effective than traditional marketing. There is a significant volume of data coming through social media. However, this advantage comes with a few challenges. One of the challenges is information chaos. Various forms of data from different sources need to be archived and analyzed. With vast amounts of data, managers might not be able to differentiate between potential customers and the general audience (Schulze et al., 2015). Another struggle is the issue of identifying the right metrics and keeping track of them. The improvement of technology has paved the way for cheap data storage. However, this poses a threat to data security. Companies are in an era where protecting consumer data is vital. Failure to do so results in loss of consumer confidence. DDM is accompanied by challenges that involve optimization, proper use of data and ROI. The problems concerning the appropriate use of data and working across various platforms need to be resolved in the future for the better use of DDM. There is a need to close the gap between the small collection of data and organizing that data for putting it to use. According to a Forbes survey of 331 executives, including presidents and vice presidents of various fields, the greatest challenge is the training offered to employees in DDM skills (Forbes.com, 2015). There is a lack of professionals, skilled enough to synthesize and use such large amounts of data. For targeting customers in today’s fast-paced world, marketers must use digital media tools like online advertising through social media, extracting the personal information of a customer through mobile (Rohm et al., 2013). Effective DDM is possible only by building a creative team of marketers with sufficient knowledge of digital advertising and new concepts such as real-time marketing. There is a need to hire the next generation of professionals with a blend of right-brained and left-brained skills. With the advancement of technology, the future role of CMOs in organizations should also evolve (Fitzgerald, 2015). CMOs in the organization should be working along with IT and other departments to make effective use of big data. The age of digital disruption has given rise to a new concept of chief marketing technologist (CMT) (Scott and Laura, 2014). In many large corporations, CMOs are being replaced by CMTs in response to the growing convergence of IT and marketing.
On the other hand, the benefits of DDM increase customer engagement, thereby increasing sales revenue of the products. With the help of DDM, companies can be customer focused (Deevi, 2015). In a survey conducted with 1,506 executives in the marketing and communication sectors, most of the respondents agreed that DDM helps in increasing customer acquisition and customer retention. It increases the efficiency and the return on investment. DDM helps in creating a more personalized experience based on different parameters, namely likewise income, age, gender, location and purchases.
3. Research methodology
3.1 Sample size
A survey was conducted and received a total of 180 (response rate approximately 80%) responses from junior, middle and senior executives. Industries in the survey included retail, BFSI, healthcare and government, automobile, telecommunications, transport and logistics, IT, aviation, marketing research, consulting, hospitality, advertising and media and human resource. In total, 34% of the respondents represented companies with less than 30 million in annual revenues, 15% from companies with 30–50 million and 50–100 million in annual revenues, 32% of the respondents from companies with 100–500 million in annual revenues and the remaining 19% represented companies with 500 million and above. With regards to the size of the organizations, 60% of the respondents belonged to companies with 1–500 employees, 13% belonged to companies with 500–1,000 employees and 26% belonged to companies with 1,000 and above employees. Of the total respondents, 26% were from senior management, 39% from middle management and the remaining 35% from junior management.
3.2 Research design
The survey was through a questionnaire circulated online. It was divided into three sections to capture the needed information. The first section focused on capturing demographic and organizational characteristics to profile the participants and the organizations they represent. Questions in the second section were adopted from the marketing metrics book “The Definitive Guide to Measuring Marketing Performance” (Farris et al., 2010). These questions focused on the understanding use of data for marketing decisions, using a ten-point Likert scale. The final section comprised questions to measure the current and proposed level of expenditure on data collection and data analytics practices in the organizations. This information was then analyzed using descriptive analytics. Descriptive analytics is the process of analyzing data from past events and finding appropriate solutions to gain insights into better outcomes. This backward-looking analysis works by obtaining a big view based on historical data that can be generated into a problem statement on which the company needs to focus. Descriptive analytics commonly uses data mining, aggregation, observation methods, study methods and survey methods to analyze data (Bertolucci, 2013).
4. Findings and analysis
4.1 Survey findings
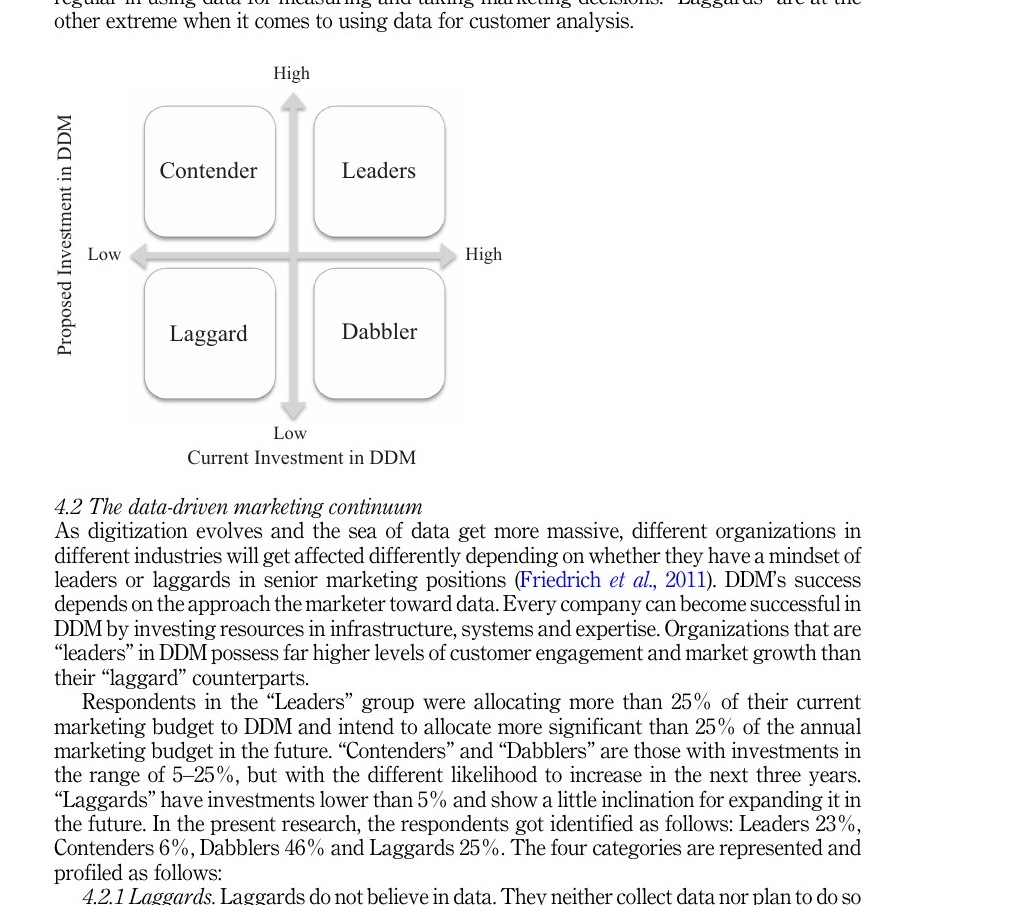
For this study, four distinct categories got identified, i.e. leaders, contenders, laggards and dabblers. Respondents got assigned to one of these categories based on their “current” investment in DDM and their “proposed” investment in DDM in the foreseeable future. Organizations currently employing data analytics for most or all of their marketing and hoping to continue in the future, i.e. their current and proposed investment is high, are defined as “Leaders” for this research. Organizations with low ongoing investment but with aspirations of high investment were categorized as “Contenders.” Organizations that have invested in DDM but are skeptical about continuing the same for the future are termed as “Dabblers.” Organizations that are yet to initiate DDM are categorized as “Laggards.” “Leaders” are from retail, banking and financial services, transportation and logistics and telecommunication sectors. The significant sources of information are point-of-sale data, social media and other published sources. They use data to understand what and why customers are buying, what their consumption patterns are and what makes them satisfied or dissatisfied. “Dabblers” are players who have realized the importance of data and have just begun to incorporate it into their marketing in a limited way. “Contenders” are far more regular in using data for measuring and taking marketing decisions. “Laggards” are at the other extreme when it comes to using data for customer analysis.
4.2 The data-driven marketing continuum
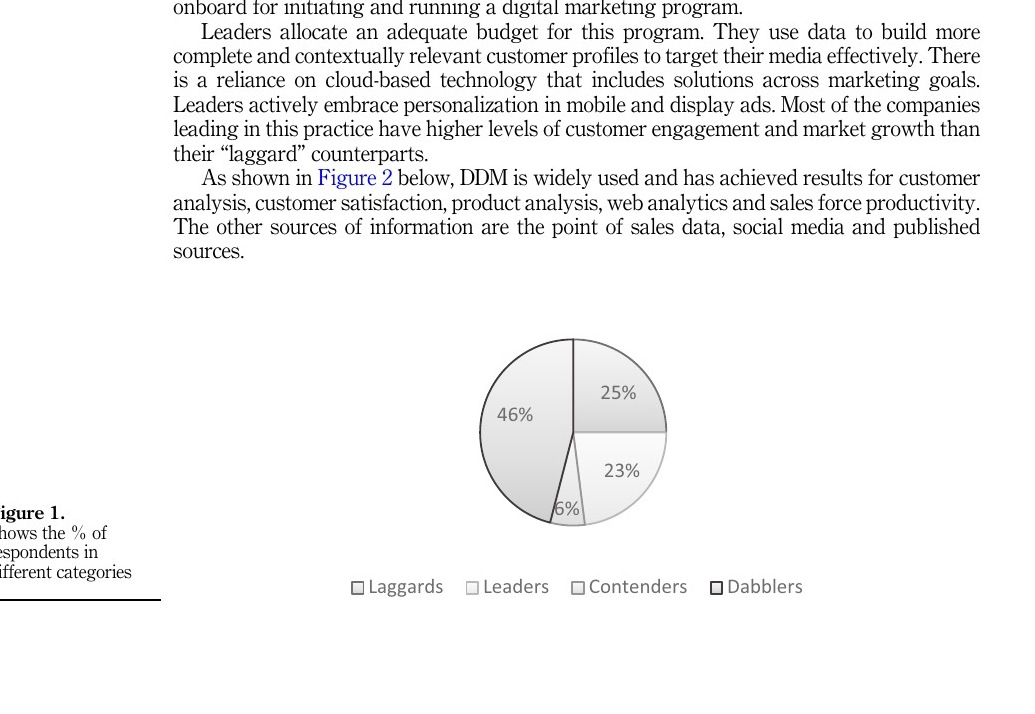
As digitization evolves and the sea of data get more massive, different organizations in different industries will get affected differently depending on whether they have a mindset of leaders or laggards in senior marketing positions (Friedrich et al., 2011). DDM’s success depends on the approach the marketer toward data. Every company can become successful in DDM by investing resources in infrastructure, systems and expertise. Organizations that are “leaders” in DDM possess far higher levels of customer engagement and market growth than their “laggard” counterparts. Respondents in the “Leaders” group were allocating more than 25% of their current marketing budget to DDM and intend to allocate more significant than 25% of the annual marketing budget in the future. “Contenders” and “Dabblers” are those with investments in the range of 5–25%, but with the different likelihood to increase in the next three years. “Laggards” have investments lower than 5% and show a little inclination for expanding it in the future. In the present research, the respondents got identified as follows: Leaders 23%, Contenders 6%, Dabblers 46% and Laggards 25%. The four categories are represented and profiled as follows:
4.2.1 Laggards.
Laggards do not believe in data. They neither collect data nor plan to do so in the future. They are unaware of the importance of DDM and are yet to understand its power and potential, resulting in problems of customer loyalty, customer engagement and market growth. The companies falling in the Laggard category employ a manual marketing effort with employees acting on their own. Departments are in different silos with little connection or coordination. Projects initiated, if any, are outsourced, resulting in a questionable quality of data delivered. Everything gets conducted on an informal basis without any direction, budget or funding.
4.2.2 Dabblers.
Dabblers are players who have realized the importance of data and have just begun to incorporate it into their marketing in a limited way. However, they lack the skill or vision to see returns. They plan digital marketing, perhaps at the sales level or within customer service departments. They neither integrate nor share data or processing capabilities with other channels. They use social media for data collection but do not examine it critically. They allocate limited funding or staff time for this cause. No formal budget is available.
4.2.3 Contenders.
Contenders are players who are far more regular in using data for measuring and making marketing decisions. They invest in building digital marketing expertise across the team. The core aim is to bring customer-facing channels together with shared data and applications. Proper training is provided to the staff to manage these processes under the supervision of a Chief Marketing Technologist for a digital marketing program. Marketers make use of various forms of engagement—such as mobile, web, social and video–– and make their digital marketing more focused and responsive to market needs. Formal budget allocation and proper metrics are used to evaluate marketing activities initiated.
4.2.4 Leaders.
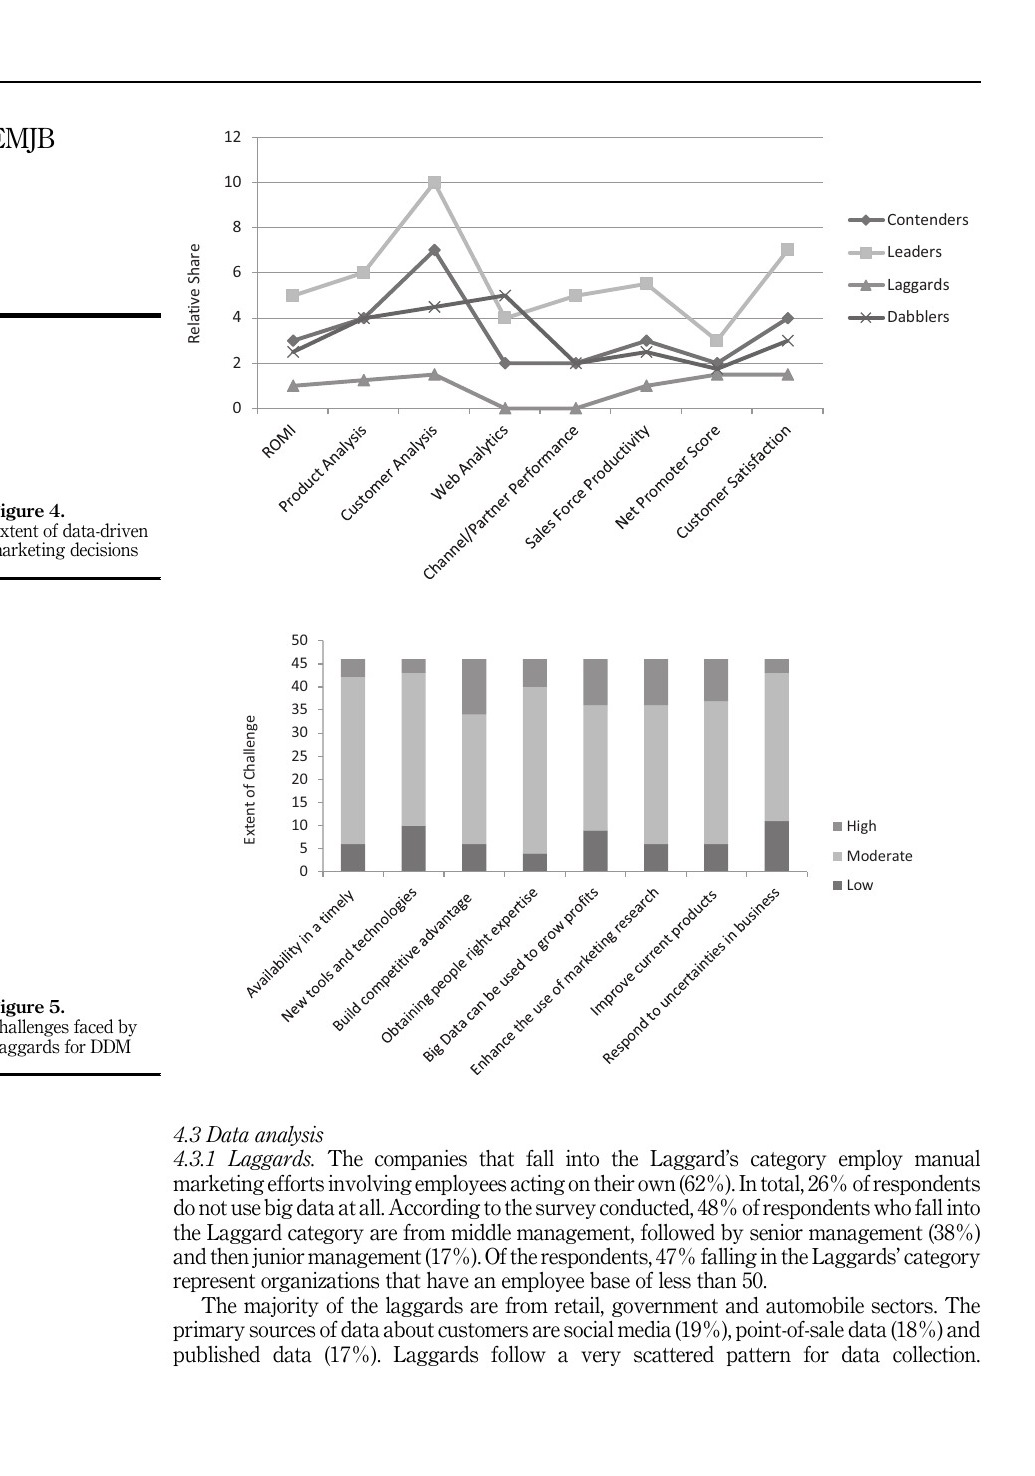
Leaders are players who are inclined toward analytics and strive to make data-driven decisions. They are digital savvy, as all their marketing decisions are based on data. Data are shared across channels freely and consistently with real-time feedback making the campaigns highly effective. Marketing function engages in tailor-made efforts to cater to customer needs. Formal metrics are used and continually refreshed and realigned. Comprehensive training is provided to staff not only to engage in digital marketing and stir innovation but also to manage these processes. They build specialized teams focused on optimizing digital marketing efforts to enhance their impact on the business. A Chief Digital Officer is appointed to lead the effort while CEO, CFO or SVP of marketing is brought onboard for initiating and running a digital marketing program. Leaders allocate an adequate budget for this program. They use data to build more complete and contextually relevant customer profiles to target their media effectively. There is a reliance on cloud-based technology that includes solutions across marketing goals. Leaders actively embrace personalization in mobile and display ads. Most of the companies leading in this practice have higher levels of customer engagement and market growth than their “laggard” counterparts. As shown in Figure 2 below, DDM is widely used and has achieved results for customer analysis, customer satisfaction, product analysis, web analytics and sales force productivity. The other sources of information are the point of sales data, social media and published sources.
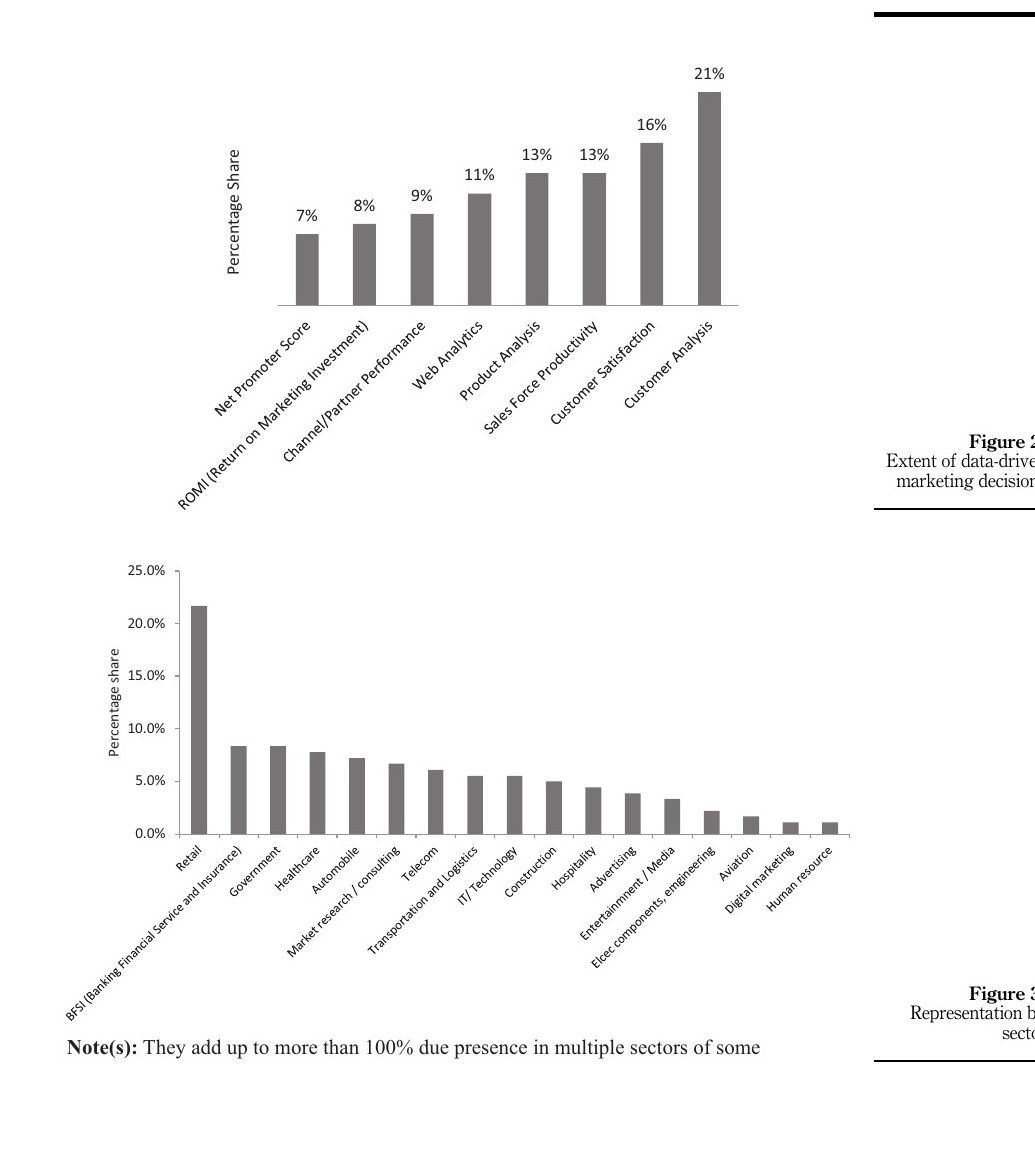
Organizations belonging to the “Leaders” category are primarily from retail, banking, transportation/logistics and telecom industries (Figure 3). These are mostly customerfocused industries using data from different sources to understand and serve customers better. Leaders are the highest users of data for taking almost all marketing decisions. Both big and small organizations need to understand their customers well, and DDM can help grow their customer base and satisfaction.
4.3 Data analysis
4.3.1 Laggards.
The companies that fall into the Laggard’s category employ manual marketing efforts involving employees acting on their own (62%). In total, 26% of respondents do not use big data at all. According to the survey conducted, 48% of respondents who fall into the Laggard category are from middle management, followed by senior management (38%) and then junior management (17%). Of the respondents, 47% falling in the Laggards’ category represent organizations that have an employee base of less than 50. The majority of the laggards are from retail, government and automobile sectors. The primary sources of data about customers are social media (19%), point-of-sale data (18%) and published data (17%). Laggards follow a very scattered pattern for data collection.
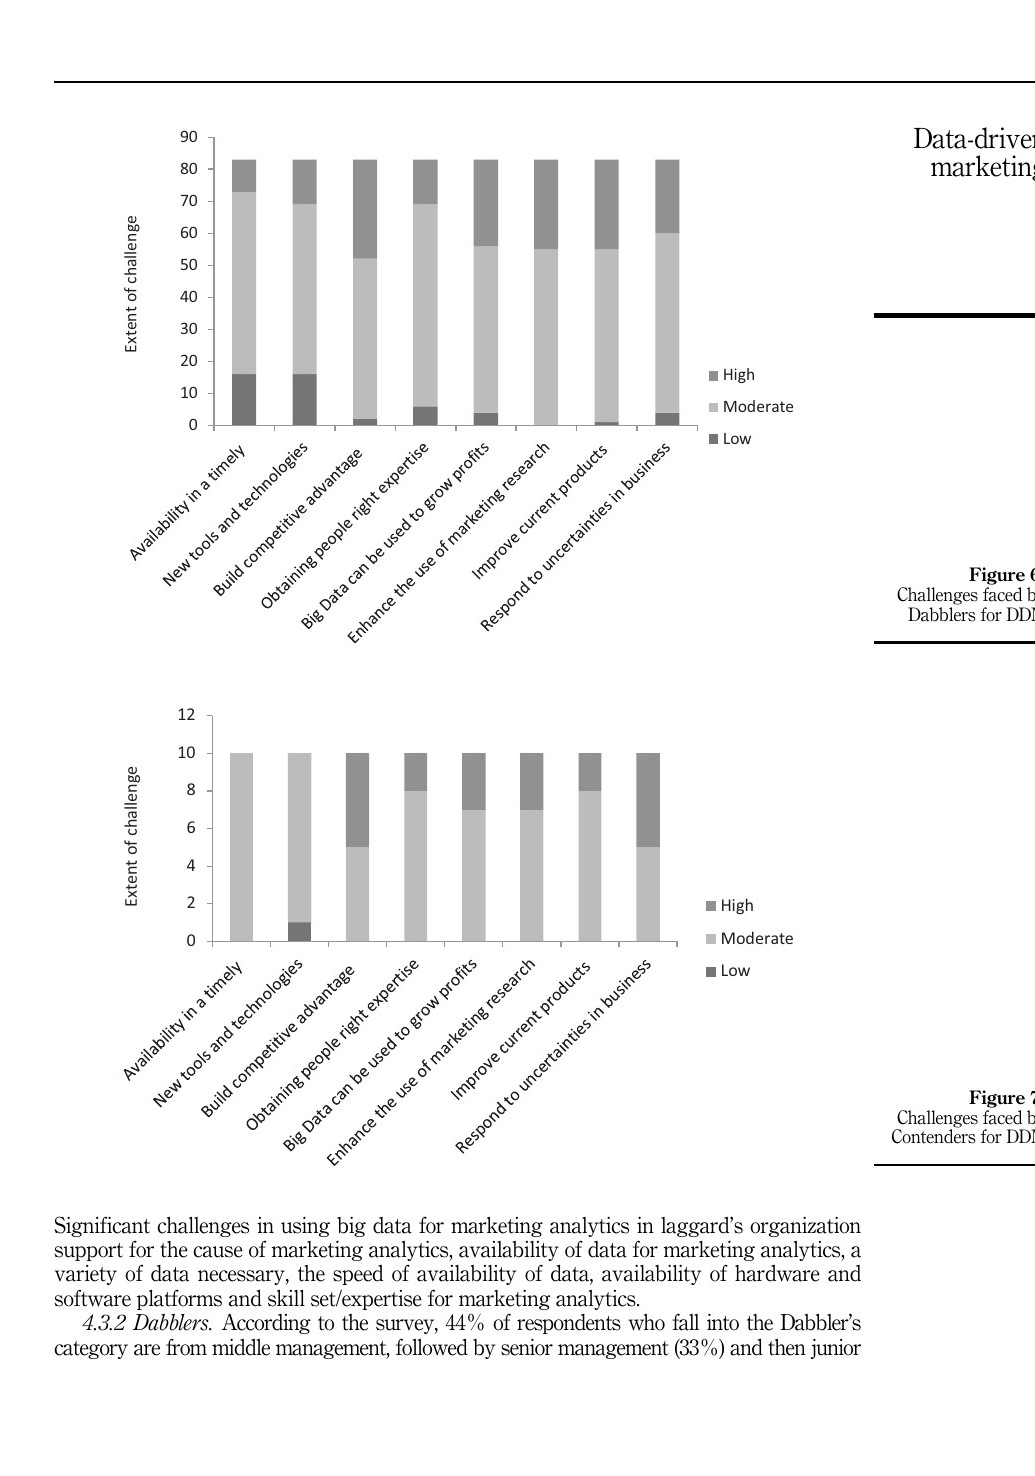
Significant challenges in using big data for marketing analytics in laggard’s organization support for the cause of marketing analytics, availability of data for marketing analytics, a variety of data necessary, the speed of availability of data, availability of hardware and software platforms and skill set/expertise for marketing analytics.
4.3.2 Dabblers.
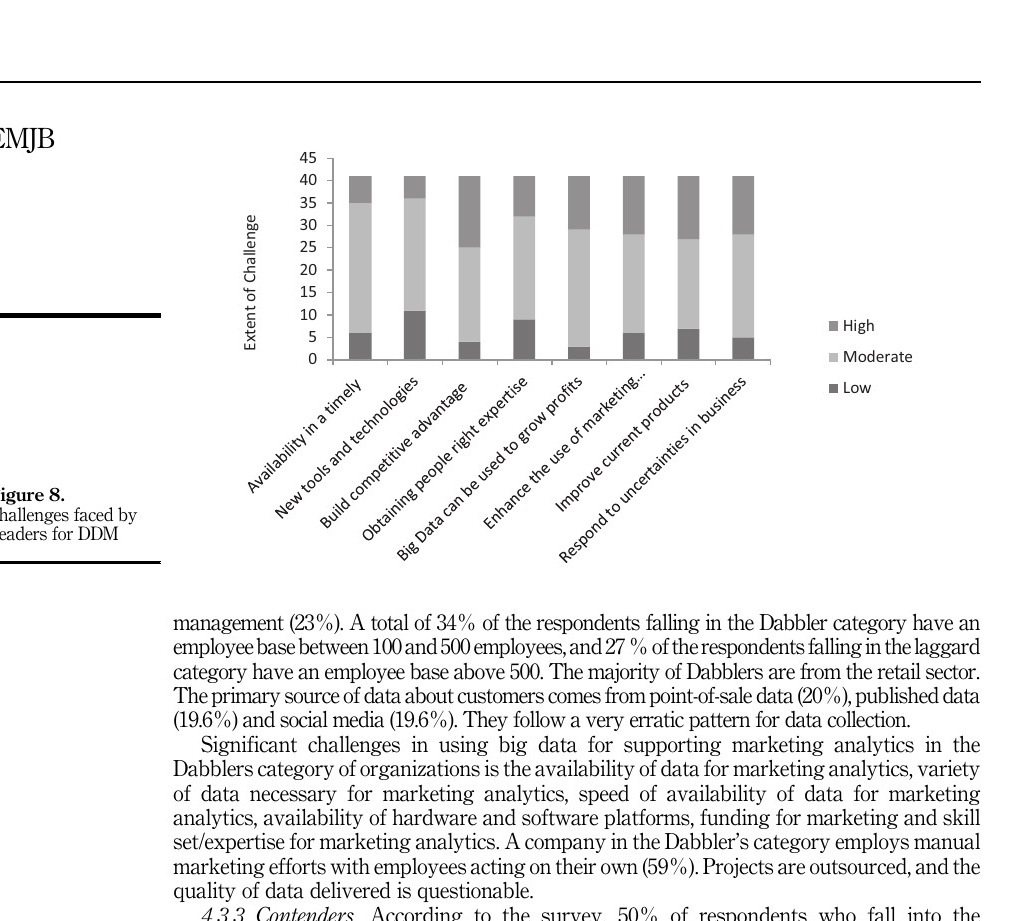
According to the survey, 44% of respondents who fall into the Dabbler’s category are from middle management, followed by senior management (33%) and then junior management (23%). A total of 34% of the respondents falling in the Dabbler category have an employee base between 100 and 500 employees, and 27 % of the respondents falling in the laggard category have an employee base above 500. The majority of Dabblers are from the retail sector. The primary source of data about customers comes from point-of-sale data (20%), published data (19.6%) and social media (19.6%). They follow a very erratic pattern for data collection. Significant challenges in using big data for supporting marketing analytics in the Dabblers category of organizations is the availability of data for marketing analytics, variety of data necessary for marketing analytics, speed of availability of data for marketing analytics, availability of hardware and software platforms, funding for marketing and skill set/expertise for marketing analytics. A company in the Dabbler’s category employs manual marketing efforts with employees acting on their own (59%). Projects are outsourced, and the quality of data delivered is questionable.
4.3.3 Contenders.
According to the survey, 50% of respondents who fall into the Contenders category are from middle management, followed by senior management (30%) and then junior management (20%). In total, 40% of the respondents in the contender’s category have an employee base between 100 and 500 employees, and 20 % have an employee base above 500. The majority of Contenders are from healthcare, technology, retail and government. The primary source of data about customers comes from point-of-sale data (25%), published data (30%) and social media (12%). Contenders regularly use analytics for driving most aspects of the business. They act as change agents, positively disrupt the status quo and are ready to invest in building digital marketing acumen across the team. In these organizations, efforts are underway to bring customer-facing channels together with shared data and applications. The staff is trained to manage these processes. Automation is promoted, and integration of various forms of engagement, such as mobile, web, social, video, etc., is implemented. Digital marketing campaigns are more focused and responsive to market needs. Metrics to measure and evaluate marketing activities are adapted to optimize marketing programs continuously.
4.3.4 Leaders.
Survey results indicate that 48% of the respondents in the leader’s category are from middle management, followed by senior management (35%) and then junior management (17%). A total of 48% of the respondents in the leader’s category have an employee base of 500–1,000 or above. Of the respondents within this category, 22 % are
medium to small players. The majority of leaders (59%) are from the retail, banking and insurance and transportation and logistics sectors. The primary sources of data about customers are point-of-sale data (20%), published data (19.6%) and social media (19.6%).
5. Study implications
Research and the research findings complement Roger’s theory of innovation with the “Leaders” as innovators, or early adopters are from retail, banking and financial services, transportation and logistics and telecommunication sectors. The significant sources of information are point-of-sales data, social media and other published sources. They use data to understand what and why customers are buying, what their consumption patterns are and what makes them satisfied or dissatisfied. “Dabblers” like early majority are players who have realized the importance of data and have just begun to incorporate it in their marketing in a limited way. “Contenders” more so act as later majority are far more regular in using data for measuring and taking marketing decisions. “Laggards” are at the other extreme when it comes to using data for customer analysis. In any organization, data-based ethical decision-making, lateral relations and organizational commitment are interrelated and work in congruence for organization success (Valentine et al., 2018). Organizations need to work toward aligning their processes, capabilities, infrastructure and talent to realize the full potential of marketing analytics. Though DDM brings in a new perspective to businesses, a healthy balance between analytics and decision maker’s intuition is the key to success. Data-driven strategic decisions are one of the critical abilities that managers are required to have and develop to lead their organizations in the VUCA business environment (Intezari and Gressel, 2017). Leaders and Contenders who use data for being customer-centric marketing need to listen to the voice of the customer to gain insights that data alone cannot capture. Top- and bottom-performing companies differ regarding their use and organizational facilitation of BA Cao and Duan (2017). Contrary to the leaders and contenders, many companies are still dragging their feet, i.e. Dabblers and Laggards. Such players need to build data-driven expertise and initiate pilot projects, i.e. starting small and then rolling it out later. An iterative and incremental approach is the need of the hour, even if it has to start with baby steps, to invest and reap the fruits of DDM. Organizations need skill, expertise, funding, tools and technology as DDM is still at a nascent stage. Employees need to be trained and motivated to take part in data-driven initiatives. Bringing about a cultural shift in the organization is essential. The biggest challenge is to bring all the scattered data to a single platform, so a complete picture of customers and their needs can be understood to provide a seamless experience for growing customer equity and brand equity.
6. Implications of research for EU nations
EU member states differ significantly on the extent to which they have harnessed their data to assist their economies and society. Differences among them exist due to economic conditions and policymakers orientations. For the member countries, it will be easier to effectively embrace data innovation to respond to the social and economic challenges effectively. Countries that lag behind today could effectively lead the EU’s competitive edge if they realize and appreciate the warp of the data economy. In business, the influx of data available to the two major constituents of the economy, customers and firms has expanded exponentially. Companies in all sectors can use sophisticated analytics and large datasets to enhance operational efficiencies, as well as to improve and expand their services to their customers (Nick, 2016).
To harness the power of data, policymakers and the governments need to prioritize three goals: (1) Maximize the supply of data via open data and freedom-of-information policies. (2) Development of the infrastructure that supports data innovation. (3) To enhance data-literacy skills in the working force. The top five countries in data innovation as the “leaders” are Denmark, Finland, the Netherlands, Sweden and the UK. These nations also enjoy higher incomes, but Germany and France, also being high-income countries, still lag behind the other countries. Luxembourg, the wealthiest nation in Europe, though rated higher than Germany and France, is still behind the other top five countries. Estonia, where GDP per capita is below the EU average, is yet ranked quite high in data innovation reflecting strong national leadership and the right policy can be. The lowest-ranking five countries are Greece, Croatia, Hungary, Bulgaria and Cyprus. These bottom five countries exhibit some of the highest levels of corruption in the EU, which reflect the need for accountability and reliable institutions for effective policymaking. Open data and freedom-of-information laws alone cannot solve endemic corruption or institutional weakness, but they are useful tools in promoting the transparency necessary to combat such problems, and thus are vital to data innovation as “Laggards” (Nick, 2017). Countries like Estonia, UK, Malta and Belgium score high for the value of market demand for data-driven products and services and moving fast to pick up speed with data innovation like “Contenders”. This indicates the importance of data to the national economy and the viability of business models built around data. The bottom five countries are Spain, Slovenia, Italy, Greece and Luxembourg. Scores of Cyprus, Malta and Bulgaria are not statistical accidents but positive indications of market demand for data-driven products and services in those countries acting as contenders but still as “Dabblers” in data innovation (Nick, 2017). Greater availability of data will drive economic efficiency, supports social and scientific research, improves transparency in public institutions and enhances the quality of life of the society at large. The government needs to adapt and promote the latest technology of collection, sharing and analyzing to harness the economy and society.
7. Limitations and conclusions
7.1 Limitations
As a result of the storming digital age and the development of analytics, the process of decisionmaking has gained significant importance. Judgment and intuition too are critical to the process. Choosing an appropriate action cannot be done strictly on a rational basis. But the irony of the digital age is that instead of humans guiding and instructing the machines, the machines now advise humans in taking the decisions. Another challenge of the explosion of data and the related field of analytics has resulted in a dearth of data analysts. In total, 74% of the companies are unable to recruit data scientists. The main reason for this imbalance is a scarcity of statisticians seeking analyst jobs. The corporate world is struggling to ask employees who can analyze and interpret big data simultaneously. Security and trust add a new challenge; the biggest concern is protecting the avalanche of data while also leveraging it for strategic decision-making. Unfortunately, the information stored is highly vulnerable to cyber attacks and breaching. Thus, there is a probability that any information provided to a third party could get leaked, resulting in distrust among customers or competitive disadvantage. Companies often do not have the appropriate platform to collect and manage data across the entire organization. This makes it difficult for the enterprise to work with huge volumes and high velocity of data for realtime analysis.
Another issue is the difficulty in seamlessly transferring data behind firewalls in a secure fashion for cloud computing. Accenture and Siemens have developed a smart grid field to focus on services provided for data management and integration. Lastly, data collecting tools are imprecise at many times; this is a major concern for social media companies intending to gather valuable insights into the massive amount of big data.
7.2 Conclusion and further scope
A study published by the Darden foundation suggests that the roadmap for implementing marketing analytics requires companies to look at three things: organizational structure, organizational change and the analytics process itself. Before any program is executed, there must be clarity on what DDM is expected to achieve. Once the organizational structure is deemed fit to support the program, it is equally essential to look at the culture of the organization. Additionally, efforts must be devoted to combining data and heuristics. The research results show that a more sophisticated analytical planning process characterizes better-performing companies. Lower performing firms should realize and acknowledge this competitive advantage and identify ways how to integrate business analytics into performance management of the organization (Hauser, 2007). Educational institutes of higher learning can play a significant role by internalizing analytics into their overall curriculum to meet the demands of the world that are already immersing in digitization (Klatt et al., 2011). Our research aligns to emphasize the need to engender a positive attitude toward business analytics for firms to more effectively transform into data-driven businesses and for the business schools to better prepare future managers (Carillo et al., 2018). Our research focuses on source data and application of data for decision-making from an increasing number of internal and external data sources, but data governance remains a significant issue. Building an agile IT infrastructure that is responsible for integrating the number of data sources, strengthening of bodies to drive cross-departmental alignment for data governance and also pervasively use of KPI’s across the organization are vital issues to be explored for an organization to leverage on data-driven decision-making.
References
- Agrawal, D. (2014), “Analytics-based decision making”, Journal of Indian Business Research, Vol. 6 No. 4, pp. 332-340.
- Ashe-Edmunds, S. (2017), Factors Influencing Decision Making in a Business Environment, Chron (accessed 14 February 2017).
- Bertolucci, J. (2013), Big Data Analytics: Descriptive vs. Predictive vs. Prescriptive (accessed 15 February 2017).
- Belwal, R. and Belwal, S. (2014), “Hypermarkets in Oman: a study of consumers’ shopping preferences”, International Journal of Retail and Distribution Management.
- Bhandari, R., Singer, M. and van der Scheer, H. (2014), Using Marketing Analytics to Drive Superior Growth, Mckinsey Quarterly.
- Bose, R. (2009), “Advanced analytics: opportunities and challenges”, Industrial Management and Data Systems, Vol. 109 No. 2, pp. 155-172.
- Braverman, S. (2015), “Global review of data-driven marketing and advertising”, Journal of Direct, Data and Digital Marketing Practice, Vol. 16 No. 3, pp. 181-183.
- Cao, G. and Duan, Y. (2017), “How do top-and bottom-performing companies differ in using business analytics?”, Journal of Enterprise Information Management, Vol. 30 No. 6, pp. 874-892.
- Carillo, K.D.A., Galy, N., Guthrie, C. and Vanhems, A. (2018), “How to turn managers into data-driven decision-makers: measuring attitudes towards business analytics”, Business Process Management Journal.
- Chismar, W.G. and Wiley-Patton, S. (2003a), “Does the extended technology acceptance model apply to physicians?”, in Proceedings of the 36th Annual Hawaii International Conference on, System Sciences, 2003, IEEE, p. 8.
- Chismar, W.G. and Wiley-Patton, S. (2003b), Does the Extended Technology Acceptance Model Apply to Physicians, HICSS.
- Davenport, T.H. (2013), “Analytics 3.0”, Harvard Business Review.
- Deevi, S. (2015), “The big data-driven business: how to use big data to win customers, beat competitors, and boost profits”, Research-Technology Management, Vol. 58 No. 3, p. 66.
- Desrosiers, J., Dumas, Y., Solomon, M.M. and Soumis, F. (1995), “Time constrained routing and scheduling”, Handbooks in Operations Research and Management Science, Vol. 8, pp. 35-139.
- Desjardins, J. (2015), The Evolution of Data, Visual Capitalist.
- Farris, P.W., Bendle, N., Pfeifer, P. and Reibstein, D. (2010), Marketing Metrics: The Definitive Guide to Measuring Marketing Performance, Pearson Education.
- Fitzgerald, M. (2015), “How to hire data-driven leaders”, MIT Sloan Management Review, Vol. 56 No. 3.
- Forbes.com (2016), Forbes, Welcome, N.P., Web (accessed 22 February 2016).
- Friedrich, R., Gr€one, F., Koster, A. and Le Merle, M. (2011), Measuring Industry Digitization: Leaders and Laggards in the Digital Economy. PWC Strategy, Originally Published by Booz & Company, December.
- Gordon, A. (2013), Analyzing Customer Behavior in Retail, Business Standard.
- Hauser, W.J. (2007), “Marketing analytics: the evolution of marketing research in the twenty-first century”, Direct Marketing: An International Journal, Vol. 1 No. 1, pp. 38-54.
- Hofacker, C.F., Malthouse, E.C. and Sultan, F. (2016), “Big data and consumer behavior: imminent opportunities”, Journal of Consumer Marketing, Vol. 33 No. 2, pp. 89-97.
- IBM CMO Study (2011), “From stretched to strengthened”, available at: ibm.com/cmostudy2011.
- Intezari, A. and Gressel, S. (2017), “Information and reformation in KM systems: big data and strategic decision-making”, Journal of Knowledge Management, Vol. 21 No. 1, pp. 71-91.
- Klatt, T., Schlaefke, M. and Moeller, K. (2011), “Integrating business analytics into strategic planning for better performance”, Journal of Business Strategy, Vol. 32 No. 6, pp. 30-39.
- Kotler, P. and Keller, K. (2001), “L.(2012)”, Marketing Management, Vol. 14.
- Kumar, V., Chattaraman, V., Neghina, C., Skiera, B., Aksoy, L. and Buoye, A., et al. (2013), “Data-driven services marketing in a connected world”, Journal of Service Management, Vol. 24 No. 3, pp. 330-352.
- Moore, J.I. (2014), 50 John Maxwell Quotes about Becoming an Amazing Leader, Everyday Power.
- Myers, J.L., Well, A. and Lorch, R.F. (2010), Research Design and Statistical Analysis, Routledge.
- Nick, W. (2016), Double Consent Rule for Sharing Data Would Be Useless, Centre for Data Innovation.
- Nick, W. (2017), State of Data Innovation in EU, Center for Data Innovation.
- Pearson, T. and Wegener, R. (2013), “Big data: the organizational challenge”, Bain Co.
- Rogers, E.M. (2004), “A prospective and retrospective look at the diffusion model”, Journal of Health Communication, Vol. 9 No. S1, pp. 13-19.
- Rohm, A., Kaltcheva, V.D. and Milne, G.R. (2013), “A mixed-method approach to examining brandconsumer interactions driven by social media”, Journal of Research in Interactive Marketing, Vol. 7 No. 4, pp. 295-311.
- Scott, B. and Laura, M. (2014), “The rise of the Chief marketing technologist”, available at: https://hbr. org/2014/07/the-rise-of-the-chief-marketing-technologist.
- Schulze, C., Sch€oler, L. and Skiera, B. (2015), “Customizing social media marketing”, MIT Sloan Management Review, Vol. 56 No. 2, p. 8.
- Valentine, S.R., Hollingworth, D. and Schultz, P. (2018), “Data-based ethical decision making, lateral relations, and organizational commitment: building positive workplace connections through ethical operations”, Employee Relations, Vol. 40 No. 6, pp. 946-963.
- Venkatesh, V. and Davis, F. (2000), “A theoretical extension of the technology acceptance model: four longitudinal field studies”, Management Science, Vol. 46 No. 2, pp. 186-204.
- Verhoef, P.C., Reinartz, W.J. and Krafft, M. (2010), “Customer engagement as a new perspective in customer management”, Journal of Service Research, Vol. 13 No. 3, pp. 247-252.
- Vrontis, D. and Thrassou, A. (2007), “A new conceptual framework for business-consumer relationships”, Marketing Intelligence and Planning, Vol. 25 No. 7, pp. 789-806.
- Vrontis, D., Thrassou, A., Chebbi, H. and Yahiaoui, D. (2012), “Transcending innovativeness towards strategic reflexivity”, Qualitative Market Research: An International Journal, Vol. 15 No. 4, pp. 420-437.
- Walker, M. (2012), Structured vs. Unstructured Data: The Rise of Data.
Further reading
Al-Darweesh and Shammah (2015), 5 Ways Data Is Making Marketing Scary Effective, Convirza. N.P. (accessed 12 February 2016). Blogs.teradata.com (2016), Data-Driven Marketing Step Three: Untangle the Data Hairball j Teradata Applications, N.P., Web (accessed 22 February 2016). BludKai (2015), Exploring Trends and Impact of Data-Driven Marketing, Interactive Advertising Bureau. Budden, R. (2013), Real-time Marketing: Instant Response Requires Cultural Change by Brand Owners, FT.Com. Cech, T.G., Spaulding, T.J. and Cazier, J.A. (2018), “Data competence maturity: developing data-driven decision making”, Journal of Research in Innovative Teaching and Learning, Vol. 11 No. 2, pp. 139-158. Chaturvedi, A. (2015), Future Group to Build More Data-Driven, Customer-Centric Processes in Line with Changing Consumer Mindsets and Behavior Jobs], The Economic Times (Online). Consumer behavior is changing with internet penetration (2012), “Business line”, available at: http:// search.proquest.com/docview/1323132943?accountid5131193. Ganesh, U. (2014), The Changing Consumer Behavior in a Digital Economy, Financial Express. Grepsr (2018), “Top 10 benefits of data-driven market segmentation - grepsr”, available at: https:// www.grepsr.com/top-10-benefits-data-driven-market-segmentation-2/ (accessed 18 Nov 2018). Holden, R.J. and Karsh, B.T. (2010), “The technology acceptance model: its past and its future in health care”, Journal of Biomedical Informatics, Vol. 43 No. 1, pp. 159-172. Lieb, R. (2017), Content-The Atomic Particle of Marketing: The Definitive Guide to Content Marketing Strategy, Kogan Page Publishers. Lindsay, KevinFollow @ (2015), The Future of Data-Driven Marketing j Adobe, Digital Marketing Blog by Adobe, N.p., Web (accessed 22 February 2016). Marshall, A., Mueck, S. and Shockley, R. (2015), “How leading organizations use big data and analytics to innovate”, Strategy and Leadership, Vol. 43 No. 5, pp. 32-39. McPherson, D. (2015), Data-driven Marketing Continues the Steep Ascent, Response: Multi-Channel Direct. Newman, D. (2015), 10 Top Trends Driving the Future of Marketing, Forbes. Proquestbus.safaribooksonline.com (2016), Customer Innovation > 01 Connect Using the First Lens > Immersive Customer Understanding - Pg, Safari Books Online, N.p., Web (accessed 22 February 2016). Renilde De Wit (n.d.), “Data-driven marketing: state, benefits and drivers”, available at: http://www.iscoop.eu/data-driven-marketing-the-state-benefits-and-drivers-of-data-marketing/.
Rouse, M. (2013), Social Media Listening, TechTarget. Sheeba Rani, L. and Baranidharan, K. (2013), “Consumer purchasing decision making process WRT FMCG”, International Journal of Retailing and Rural Business Perspectives, Vol. 2 No. 1, pp. 309-313. Simons, R.H. and Thompson, B.M. (1998), “Strategic determinants: the context of managerial decision making”, Journal of Managerial Psychology, Vol. 13 Nos 1-2, pp. 7-21. Sundsøy, P., Bjelland, J., Iqbal, A.M. and de Montjoye, Y.A. (2014), “Big data-driven marketing: how machine learning outperforms marketers’ gut-feeling”, International Conference on Social Computing, Behavioral-Cultural Modeling, and Prediction, Springer, Cham, pp. 367-374. Theirl, D. (2015), White Paper: Data Driven Market Decisions in the Retail Industry, eTail West, RubicLoud (accessed 9 June 2015). Turn (2015), Data-Driven and Digitally Savvy: The Rise of the New Marketing Organization, Forbes.com. Venkatesan, R., Farris, P. and Wilcox, R.T. (2015), Cutting-edge Marketing Analytics: Real-World Cases and Data Sets for Hands-On Learning, Pearson Education. Venkatesh, V. (2000), “Determinants of perceived ease of use: integrating control, intrinsic motivation, and emotion into the technology acceptance model”, Information Systems Research, Vol. 11 No. 4, pp. 342-365. Wallace, N. and Castro, D. (2017), The State of Data Innovation in the EU, Center for Data Innovation. Corresponding author Nitin Patwa can be contacted at: [email protected]